Gallery
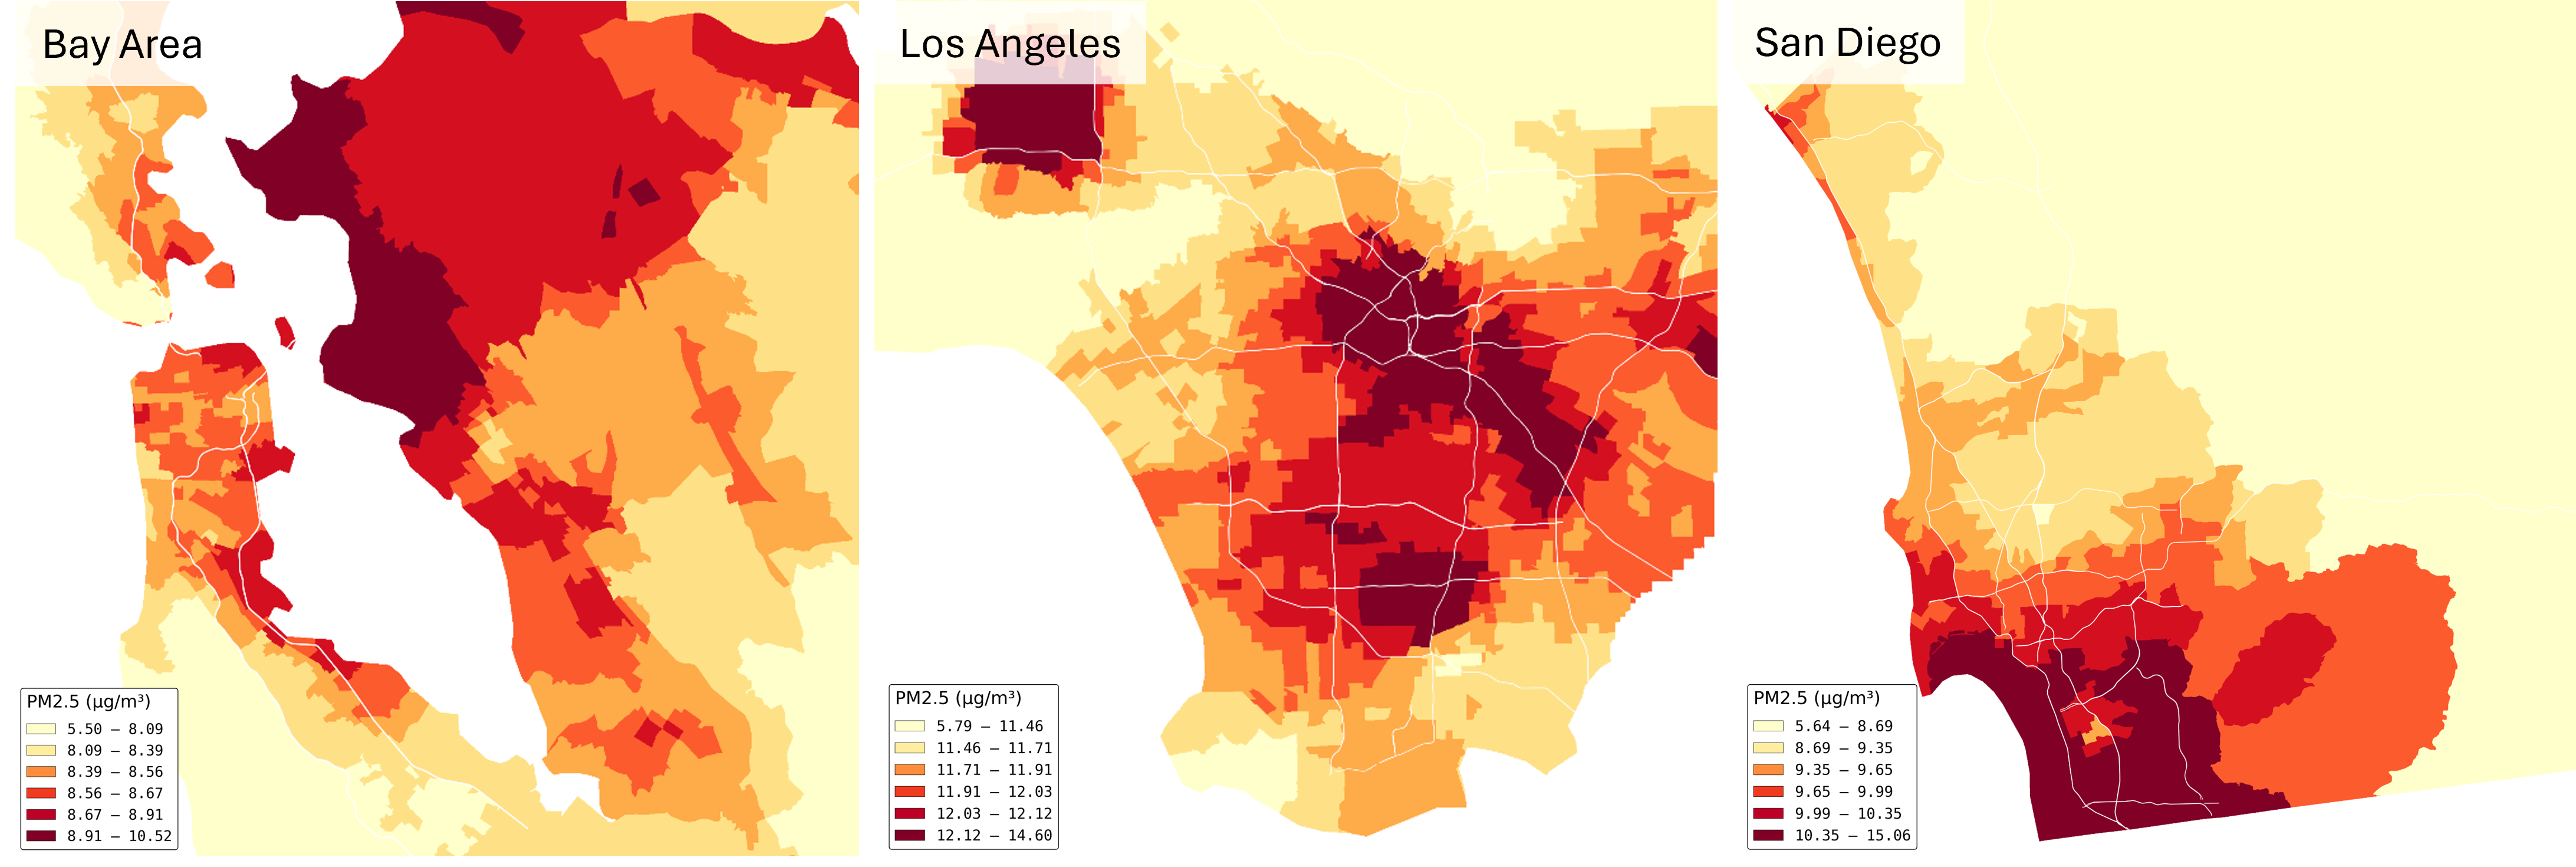
Urban air pollution remains one of the most pressing environmental justice concerns in California. PM2.5—particulate matter smaller than 2.5 microns—can deeply penetrate the lungs and bloodstream, exacerbating respiratory and cardiovascular issues. This project compares regional concentrations of PM2.5 across three major metropolitan areas to explore how air quality relates to urban infrastructure, geography, and spatial inequality.
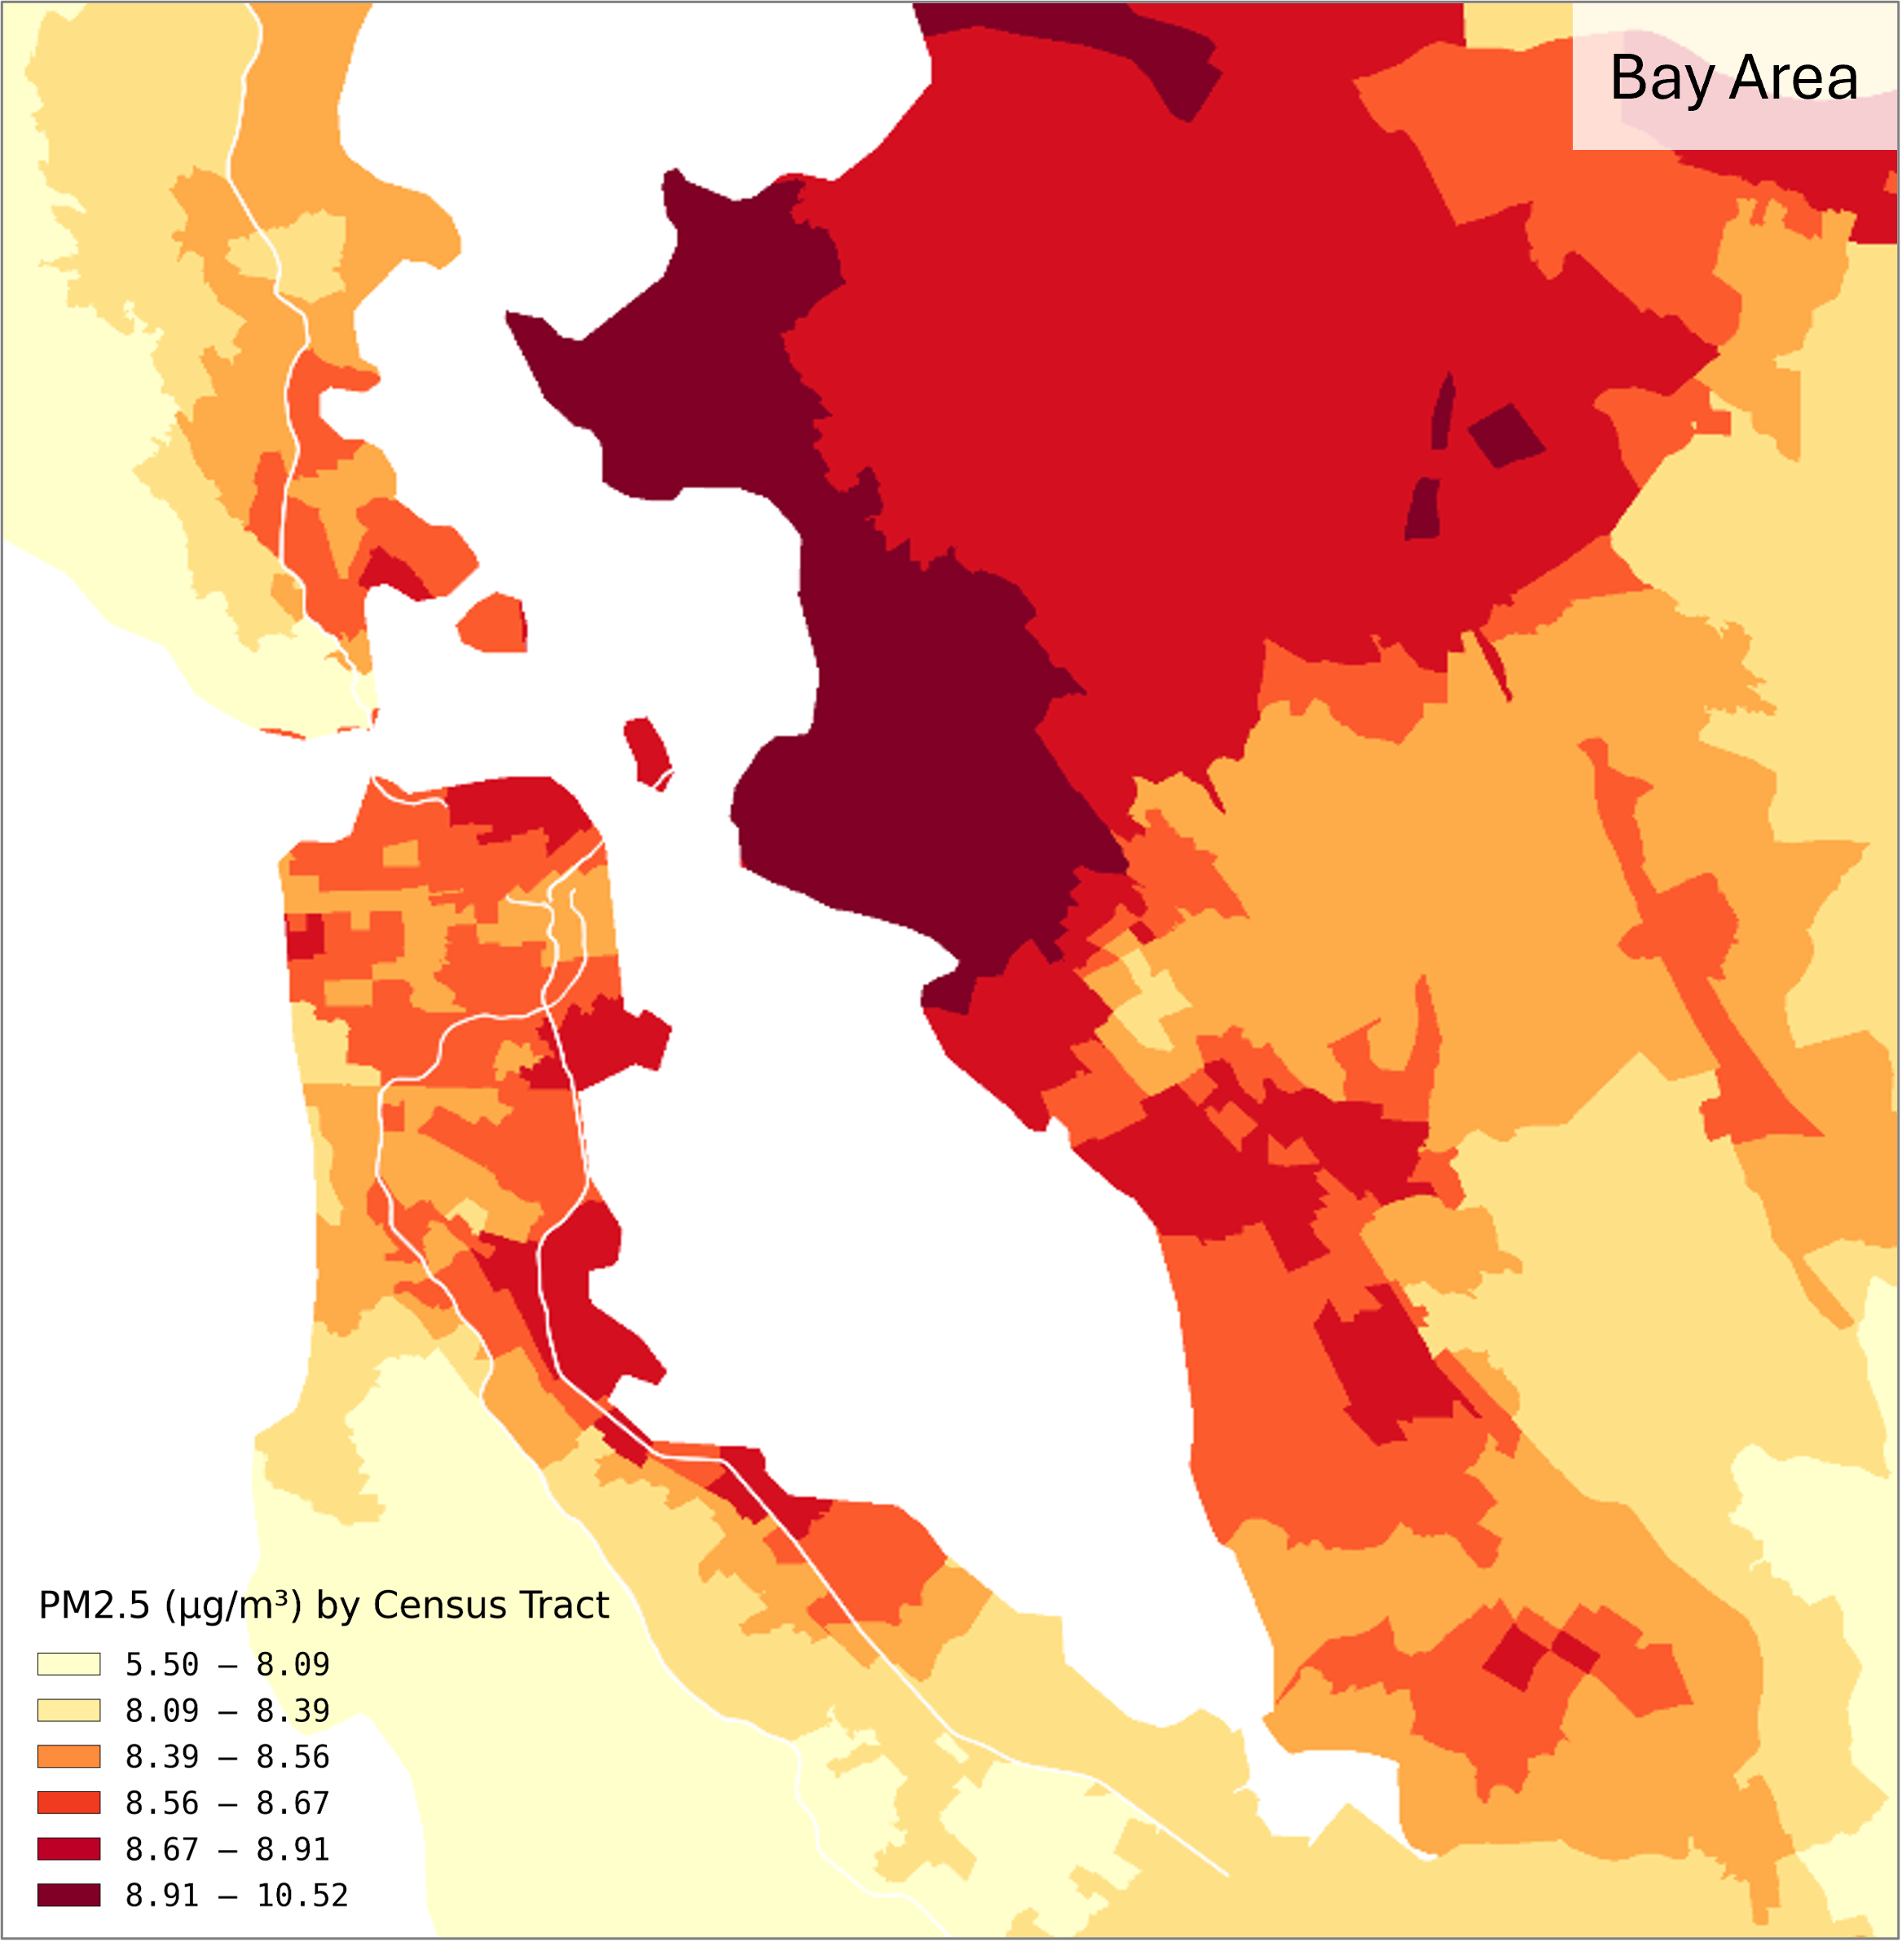
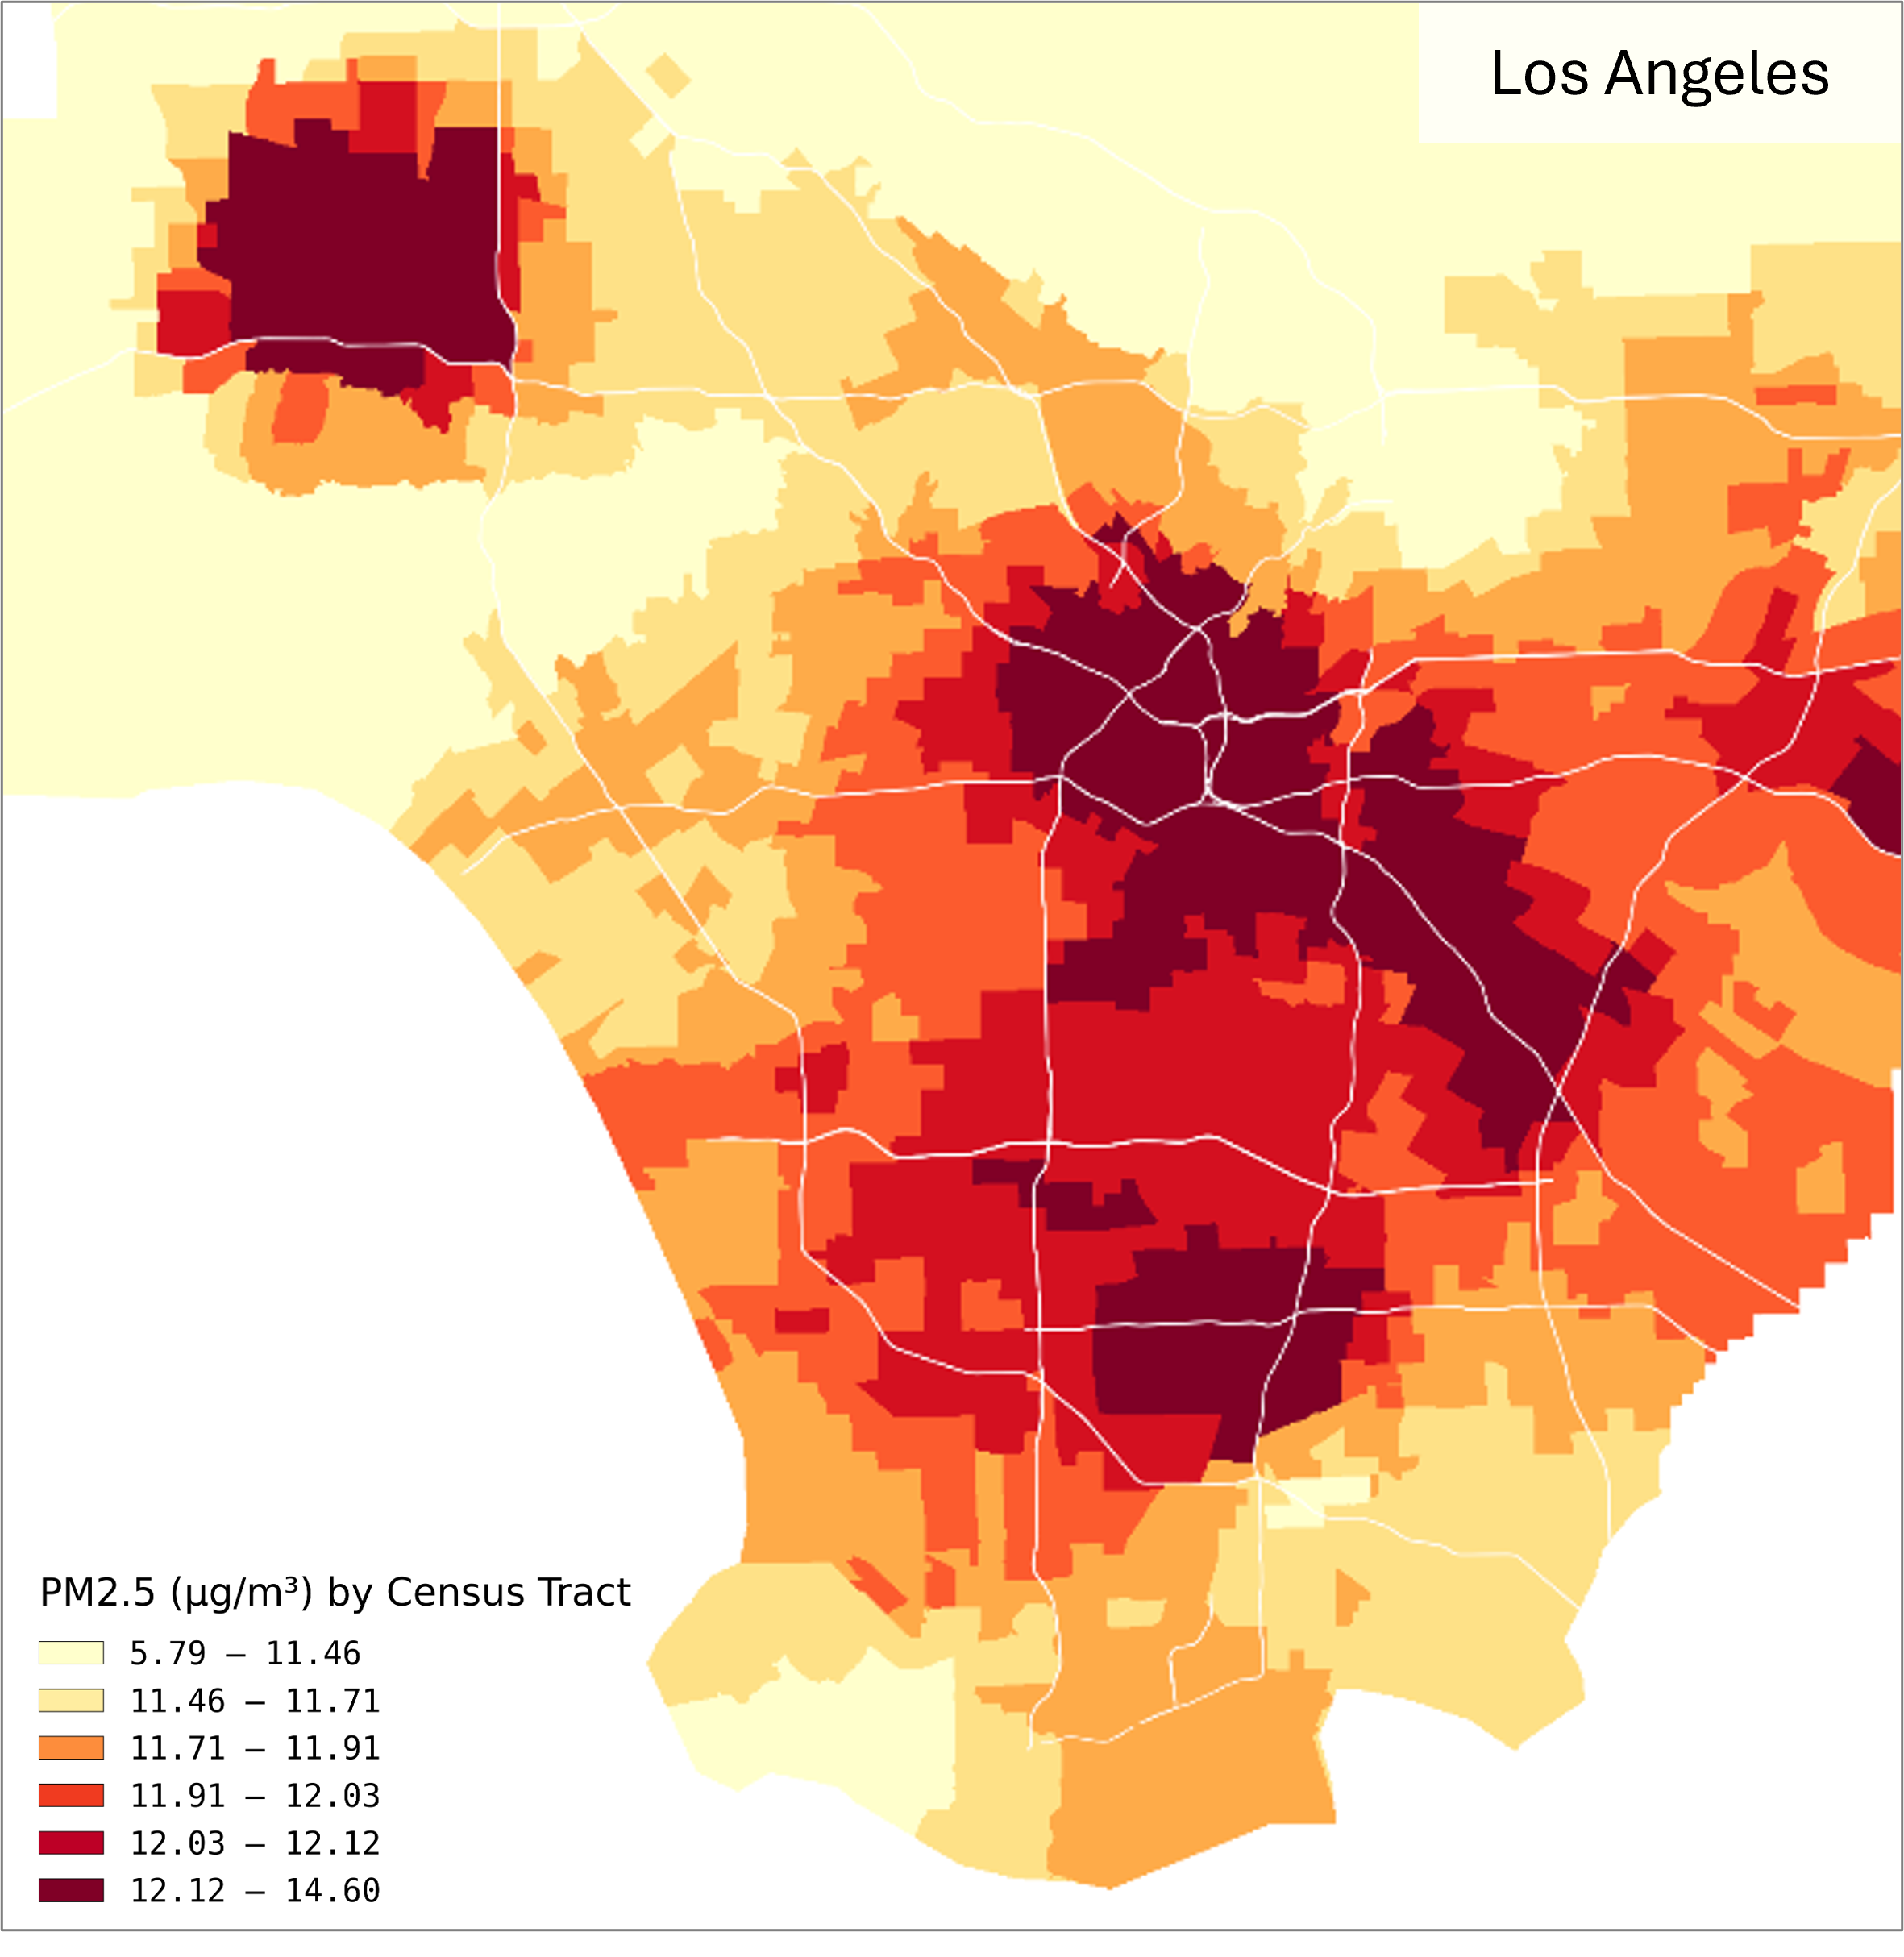
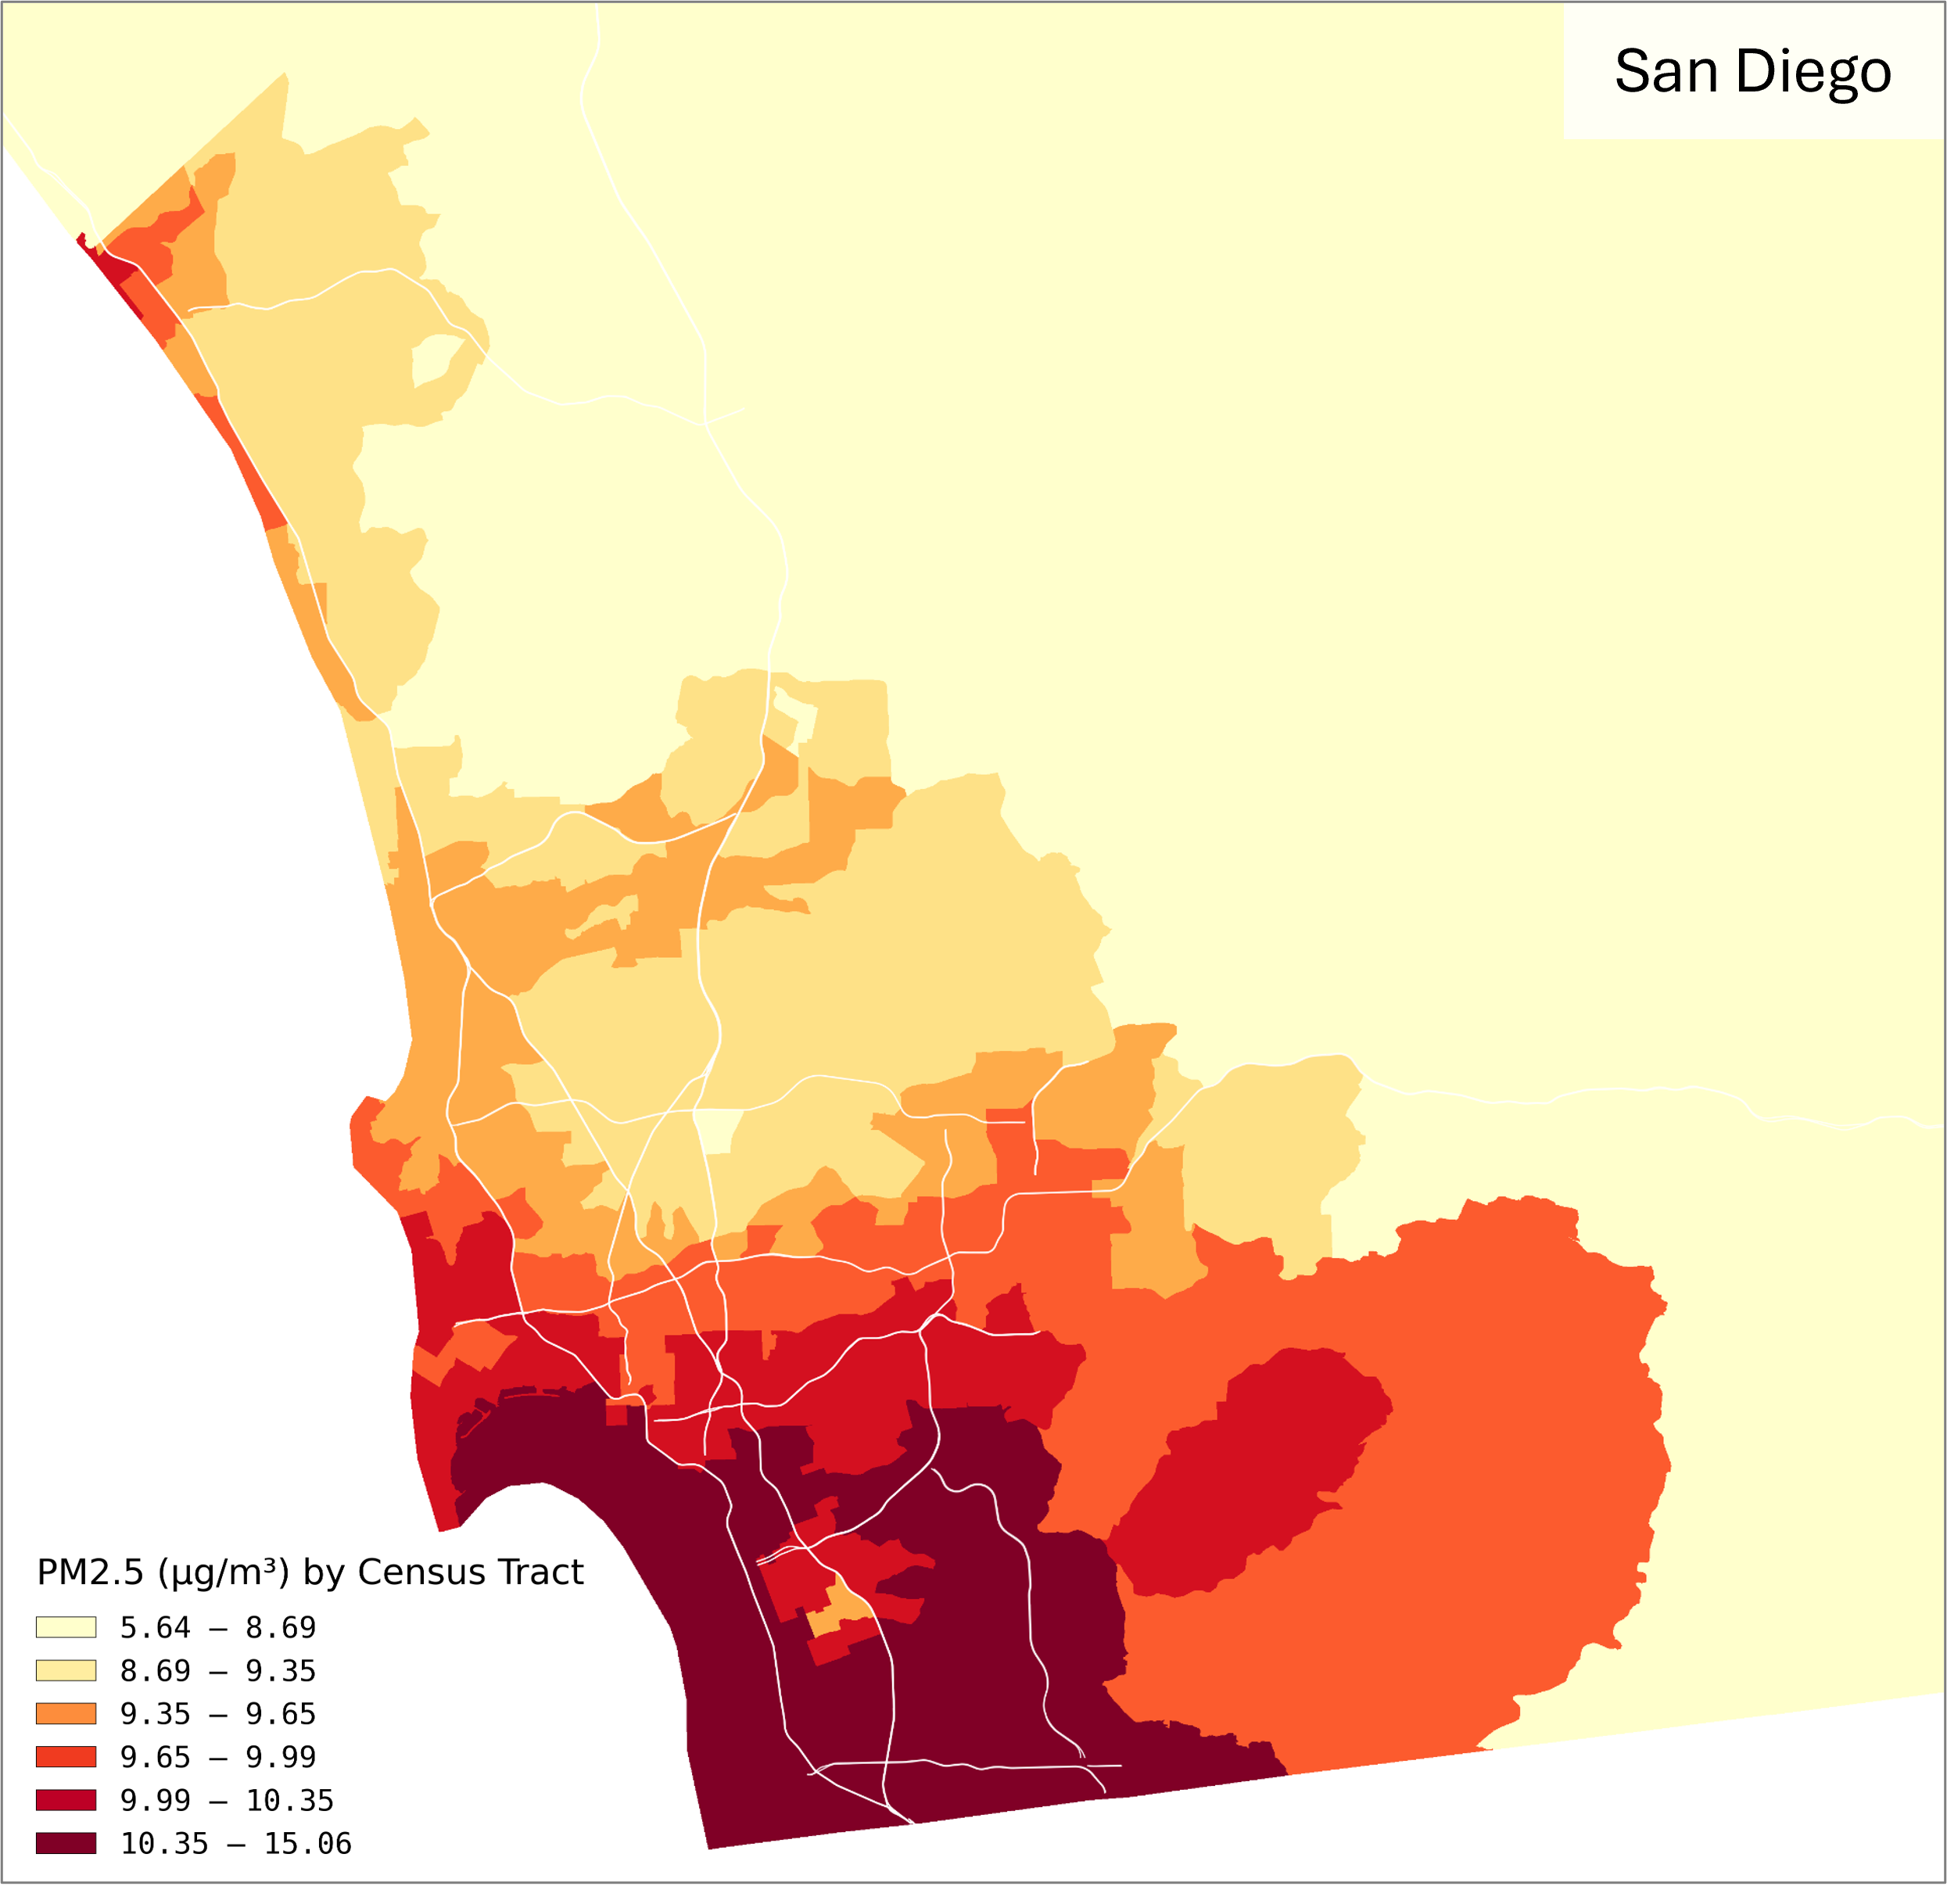
Used CalEnviroScreen 4.0 to map census tract-level PM2.5 exposure across California metros.
Clipped TIGER/Line road shapefiles to show infrastructure-adjacent pollution patterns.
Used region-specific quantile binning to handle skewed PM2.5 distributions and ensure meaningful visual comparison across metros.
Built a lightweight pipeline using Python, GeoPandas, and Matplotlib for preprocessing and map generation.
Exported high-resolution PNGs and standalone legends for professional-quality visual outputs.